DRAG DROP - (Topic 2)
You need to create a DAX measure in the data model that only allows users to see projections at the appropriate levels of granularity.
How should you complete the measure? To answer, drag the appropriate values to the correct targets. Each value may be used once, more than once, or not at all. You may need to drag the split bar between panes or scroll to view content.
NOTE: Each correct selection is worth one point.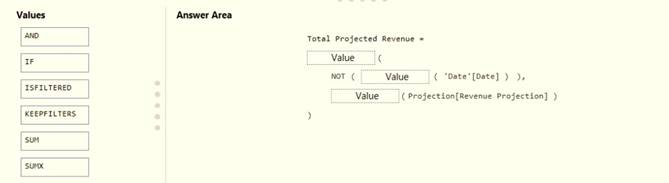
Solution:
Scenario: Revenue projections are set at the monthly level and summed to show projections for the quarter.
Box 1: IF
Box 2: ISFILTERED
ISFILTERED returns TRUE when columnName is being filtered directly. If there is no filter on the column or if the filtering happens because a different column in the same table or in
a related table is being filtered then the function returns FALSE. Box 3: SUM
Does this meet the goal?
Correct Answer:
A
- (Topic 4)
You are creating a Power Bl report by using Power Bi Desktop.
You need to include a visual that shows trends and other useful information automatically. The visual must update based on selections in other visuals.
Which type of visual should you use?
Correct Answer:
D
HOTSPOT - (Topic 4)
You have a report in Power BI Desktop as shown in the following exhibit.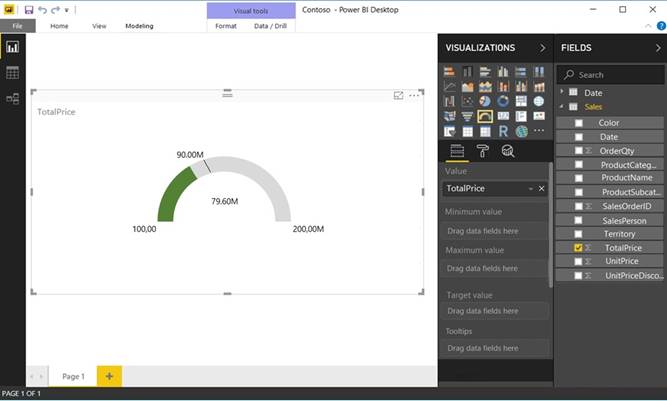
Use the drop-down menus to select the answer choice that completes each statement based on the information presented in the graphic.
Note: Each correct selection is worth one point.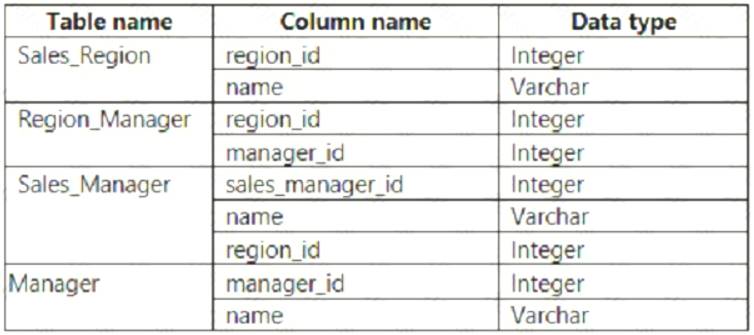
Solution: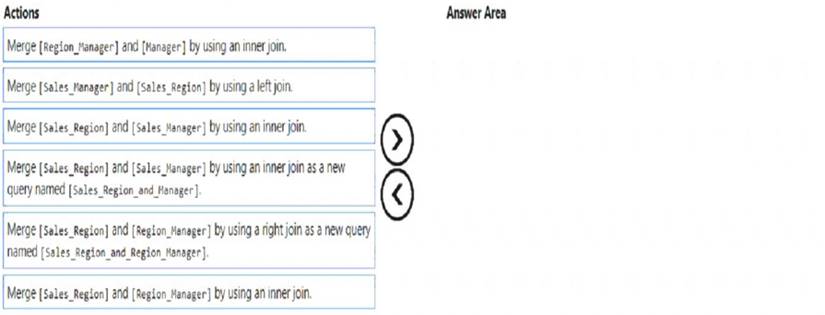
Does this meet the goal?
Correct Answer:
A
- (Topic 4)
You need to create the On-Time Shipping report.
The report must include a visualization that shows the percentage of late orders. Which type of visualization should you create?
Correct Answer:
B
DRAG DROP - (Topic 4)
You have a Microsoft Power BI data model that contains three tables named Sales, Product, and Date.
The Sales table has an existing measure named [Total Sales] that sums the total sales from the Sales table.
You need to write a calculation that returns the percentage of total sales that a selected ProductCategoryName value represents. The calculation must respect any slicers on ProductCategoryName and must show the percentage of visible total sales. For example, if there are four ProductCategoryName values, and a user filters one out, a table showing ProductCategoryName and the calculation must sum up to 100 percent.
How should you complete the calculation? To answer, drag the appropriate values to the correct targets. Each value may be used once, more than once, or not at all. You may need to drag the split bar between panes or scroll to view content.
NOTE: Each correct selection is worth one point.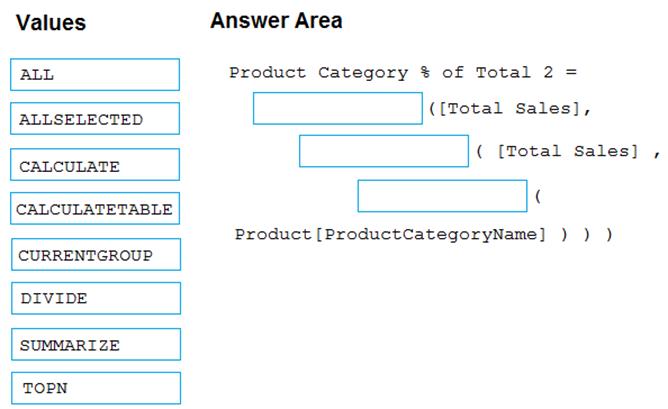
Solution:
Divide, Calculate, AllSelected.
Does this meet the goal?
Correct Answer:
A