- (Topic 4)
You have a Power BI report that contains one page. The page contains two line charts and one bar chart.
You need to ensure that users can perform the following tasks for all three visuals:
✑ Switch the measures used in the visuals.
✑ Change the visualization type.
✑ Add a legend.
The solution must minimize development effort. What should you do?
Correct Answer:
C
DRAG DROP - (Topic 4)
You use Power Query Editor to preview customer feedback data.
You need to use Al Insights to add a column of enhanced data based on the customer feedback. The solution must identify the following:
• What the customers most often provide feedback about
• Whether the customers like your company’s product
• The language of the feedback
Which Al Insights service should you use for each output? To answer, drag the appropriate services to the correct outputs. Each service may be used once, more than once. or not at all. You may need to drag the split bar between panes or scroll to view content.
NOTE: Each correct selection is worth one point.
Solution:
Does this meet the goal?
Correct Answer:
A
- (Topic 4)
You are reviewing a query that produces 10,000 rows in the Power Query Editor. You need to identify whether a column contains only unique values.
Which two Data Preview options can you use? Each correct answer presents a complete solution.
NOTE: Each correct selection is worth one point.
Correct Answer:
AB
B: Column distribution: This feature provides a set of visuals underneath the names of the columns that showcase the frequency and distribution of the values in each of the columns. The data in these visualizations is sorted in descending order from the value with the highest frequency.
By hovering over the distribution data in any of the columns, you get information about the overall data in the column (with distinct count and unique values).
A: Column profile: This feature provides a more in-depth look at the data in a column [compared to column distribution]. Apart from the column distribution chart, it contains a column statistics chart.
Reference:
https://docs.microsoft.com/en-us/power-query/data-profiling-tools
- (Topic 4)
You have a query that returns the data shown in the following exhibit.
You need to configure the query to display the data as shown in the following exhibit.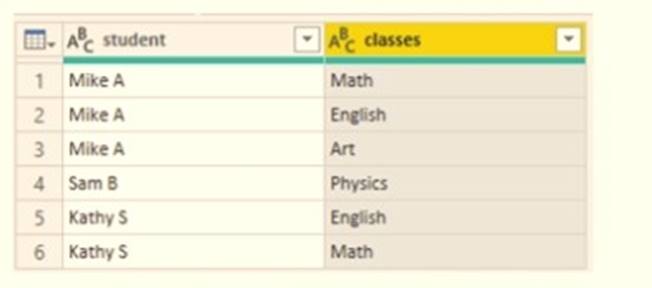
Which step should you use in the query?
Correct Answer:
B
Power Query Unpivot columns: You might want to unpivot data, sometimes called flattening the data, to put it in a matrix format so that all similar values are in one column. This is necessary, for example, to create a chart or a report.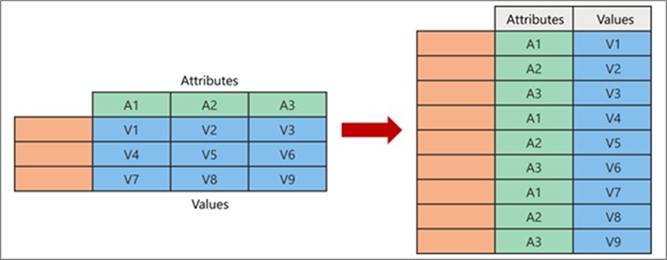
Chart Description automatically generated
Note:
Syntax: Table.Unpivot(table as table, pivotColumns as list, attributeColumn as text, valueColumn as text) as table
Table.Unpivot translates a set of columns in a table into attribute-value pairs, combined with the rest of the values in each row.
Reference:
https://docs.microsoft.com/en-us/power-query/unpivot-column https://docs.microsoft.com/en-us/powerquery-m/table-unpivot
- (Topic 4)
You are creating a visual to show the ranking of product categories by sales revenue.
Your company's security policy states that you cannot send data outside of your Microsoft Power Bl tenant
Which approach provides the widest variety of visuals while adhering to the security policy?
Correct Answer:
C