DRAG DROP - (Topic 4)
You create a data model in Power BI.
Report developers and users provide feedback that the data model is too complex. The model contains the following tables.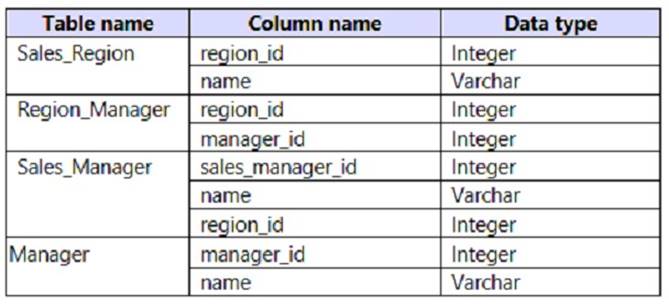
The model has the following relationships:
*There is a one-to-one relationship between Sales_Region and Region_Manager.
*There are more records in Manager than in Region_Manager, but every record in Region_Manager has a corresponding record in Manager.
*There are more records in Sales_Manager than in Sales_Region, but every record in Sales_Region has a corresponding record in Sales_Manager.
You need to denormalize the model into a single table. Only managers who are associated to a sales region must be included in the reports.
Which three actions should you perform in sequence? To answer, move the appropriate actions from the list of actions to the answer area and arrange them in the correct order.
NOTE: More than one order of answer choices is correct. You will receive credit for any of the correct orders you select.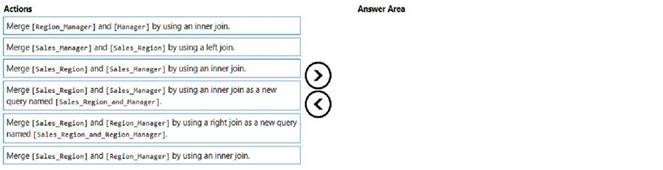
Solution:
* 1.Merge [Region_Manager] and [Manager] by using an inner join. 3.Merge [Sales_Region] and [Sales_Manager] by using an inner join. 6.Merge [Sales_Region] and [Region_Manager] by using an inner join.
Does this meet the goal?
Correct Answer:
A
DRAG DROP - (Topic 4)
You use Power Bi Desktop to create a Power Bl data model and a blank report You need to add the Word Cloud visual shown in the following exhibit to the report.
The solution must minimize development effort
Which three actions should you perform in sequence? To answer, move the appropriate actions from the list of actions to the answer area and arrange them in the correct order.
Solution: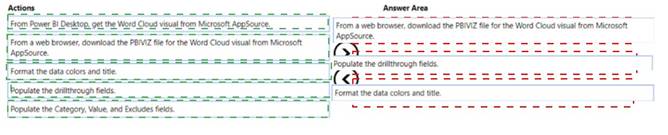
Does this meet the goal?
Correct Answer:
A
- (Topic 4)
You have the following table named Location.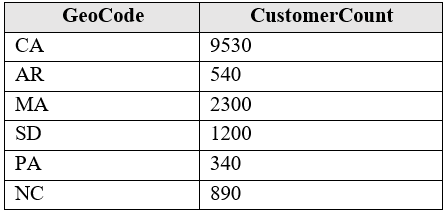
The GeoCode column represents the country where each customer is located. You create a map visualization as shown in the exhibit. (Click the Exhibit tab.)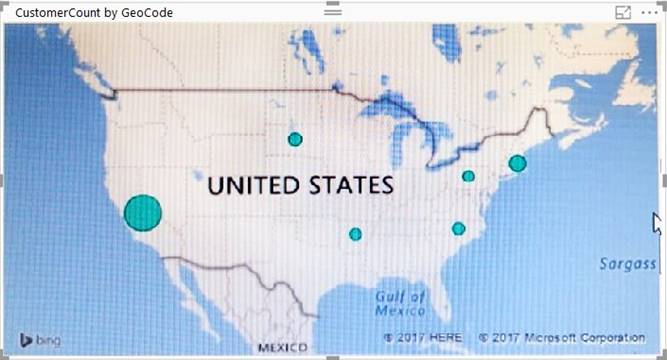
You need to ensure that the map displays the country locations. What should you do?
Correct Answer:
B
References:
https://docs.microsoft.com/en-us/power-bi/visuals/power-bi-map-tips-and-tricks
- (Topic 4)
You have a Rawer Bl report That imports a dace table and a sales table from an Azure SQL database data source. The sales table has the following date foreign keys:
• Due Date
• Order Date
• Delivery Date
You need to support the analysis of sales over time based on all three dates at the same time.
Solution: From the Fields pane, you rename the date table as Due Date. You use a DAX expression to create Order Date and Delivery Date as calculated tables. You create active relationships between the sales table and each date table.
Does this meet the goal?
Correct Answer:
A
- (Topic 4)
You have four sales regions. Each region has multiple sales managers.
You implement row-level security (RLS) in a data model. You assign the relevant distribution lists to each role.
You have sales reports that enable analysis by region. The sales managers can view the sales records of their region. The sales managers are prevented from viewing records from other regions.
A sales manager changes to a different region.
You need to ensure that the sales manager can see the correct sales data. What should you do?
Correct Answer:
D
Using AD Security Groups, you no longer need to maintain a long list of users.
All that you will need to do is to put in the AD Security group with the required permissions and Power BI will do the REST! This means a small and simple security file with the permissions and AD Security group.
Note: Configure role mappings
Once published to Power BI, you must map members to dataset roles.
Members can be user accounts or security groups. Whenever possible, we recommend you map security groups to dataset roles. It involves managing security group memberships in Azure Active Directory. Possibly, it delegates the task to your network administrators.
Reference:
https://www.fourmoo.com/2018/02/20/dynamic-row-level-security-is-easy-with-active-directory-security-groups/
https://docs.microsoft.com/en-us/power-bi/guidance/rls-guidance