A junior data engineer is working to implement logic for a Lakehouse table named silver_device_recordings. The source data contains 100 unique fields in a highly nested JSON structure.
The silver_device_recordings table will be used downstream to power several production monitoring dashboards and a production model. At present, 45 of the 100 fields are being used in at least one of these applications.
The data engineer is trying to determine the best approach for dealing with schema declaration given the highly-nested structure of the data and the numerous fields.
Which of the following accurately presents information about Delta Lake and Databricks that may impact their decision-making process?
Correct Answer:
D
This is the correct answer because it accurately presents information about Delta Lake and Databricks that may impact the decision-making process of a junior data engineer who is trying to determine the best approach for dealing with schema declaration given the highly-nested structure of the data and the numerous fields. Delta Lake and Databricks support schema inference and evolution, which means that they can automatically infer the schema of a table from the source data and allow adding new columns or changing column types without affecting existing queries or pipelines. However, schema inference and evolution may not always be desirable or reliable, especially when dealing with complex or nested data structures or when enforcing data quality and consistency across different systems. Therefore, setting types manually can provide greater assurance of data quality enforcement and avoid potential errors or conflicts due to incompatible or unexpected data types. Verified References: [Databricks Certified Data Engineer Professional], under “Delta Lake” section; Databricks Documentation, under “Schema inference and partition of streaming DataFrames/Datasets” section.
A Delta Lake table in the Lakehouse named customer_parsams is used in churn prediction by the machine learning team. The table contains information about customers derived from a number of upstream sources. Currently, the data engineering team populates this table nightly by overwriting the table with the current valid values derived from upstream data sources.
Immediately after each update succeeds, the data engineer team would like to determine the difference between the new version and the previous of the table.
Given the current implementation, which method can be used?
Correct Answer:
C
Delta Lake provides built-in versioning and time travel capabilities, allowing users to query previous snapshots of a table. This feature is particularly useful for understanding changes between different versions of the table. In this scenario, where the table is overwritten nightly, you can use Delta Lake's time travel feature to execute a query comparing the latest version of the table (the current state) with its previous version. This approach effectively identifies the differences (such as new, updated, or deleted records) between the two versions. The other options do not provide a straightforward or efficient way to directly compare different versions of a Delta Lake table.
References:
✑ Delta Lake Documentation on Time Travel: Delta Time Travel
✑ Delta Lake Versioning: Delta Lake Versioning Guide
Which statement describes Delta Lake optimized writes?
Correct Answer:
A
Delta Lake optimized writes involve a shuffle operation before writing out data to the Delta table. The shuffle operation groups data by partition keys, which can lead to a reduction in the number of output files and potentially larger files, instead of multiple smaller files. This approach can significantly reduce the total number of files in the table, improve read performance by reducing the metadata overhead, and optimize the table storage layout, especially for workloads with many small files.
References:
✑ Databricks documentation on Delta Lake performance tuning: https://docs.databricks.com/delta/optimizations/auto-optimize.html
When evaluating the Ganglia Metrics for a given cluster with 3 executor nodes, which indicator would signal proper utilization of the VM's resources?
Correct Answer:
E
In the context of cluster performance and resource utilization, a CPU utilization rate of around 75% is generally considered a good indicator of efficient resource usage. This level of CPU utilization suggests that the cluster is being effectively used without being overburdened or underutilized.
✑ A consistent 75% CPU utilization indicates that the cluster's processing power is being effectively employed while leaving some headroom to handle spikes in workload or additional tasks without maxing out the CPU, which could lead to performance degradation.
✑ A five Minute Load Average that remains consistent/flat (Option A) might indicate underutilization or a bottleneck elsewhere.
✑ Monitoring network I/O (Options B and C) is important, but these metrics alone don't provide a complete picture of resource utilization efficiency.
✑ Total Disk Space (Option D) remaining constant is not necessarily an indicator of proper resource utilization, as it's more related to storage rather than computational efficiency.
References:
✑ Ganglia Monitoring System: Ganglia Documentation
✑ Databricks Documentation on Monitoring: Databricks Cluster Monitoring
A table named user_ltv is being used to create a view that will be used by data analysts on various teams. Users in the workspace are configured into groups, which are used for setting up data access using ACLs.
The user_ltv table has the following schema:
email STRING, age INT, ltv INT
The following view definition is executed: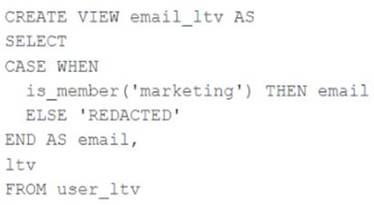
An analyst who is not a member of the marketing group executes the following query: SELECT * FROM email_ltv
Which statement describes the results returned by this query?
Correct Answer:
E
The code creates a view called email_ltv that selects the email and ltv columns from a table called user_ltv, which has the following schema: email STRING, age INT, ltv INT. The code also uses the CASE WHEN expression to replace the email values with the string “REDACTED” if the user is not a member of the marketing group. The user who executes the query is not a member of the marketing group, so they will only see the email and ltv columns, and the email column will contain the string “REDACTED” in each row. Verified References: [Databricks Certified Data Engineer Professional], under
“Lakehouse” section; Databricks Documentation, under “CASE expression” section.