- (Exam Topic 3)
You plan to explore demographic data for home ownership in various cities. The data is in a CSV file with the following format:
age,city,income,home_owner 21,Chicago,50000,0 35,Seattle,120000,1 23,Seattle,65000,0 45,Seattle,130000,1 18,Chicago,48000,0
You need to run an experiment in your Azure Machine Learning workspace to explore the data and log the results. The experiment must log the following information: the number of observations in the dataset a box plot of income by home_owner a dictionary containing the city names and the average income for each city
You need to use the appropriate logging methods of the experiment’s run object to log the required information.
How should you complete the code? To answer, drag the appropriate code segments to the correct locations. Each code segment may be used once, more than once, or not at all. You may need to drag the split bar between panes or scroll to view content.
NOTE: Each correct selection is worth one point.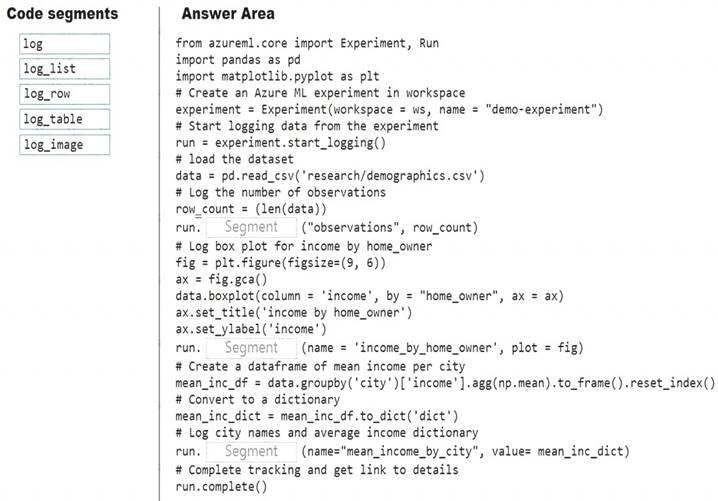
Solution:
Box 1: log
The number of observations in the dataset. run.log(name, value, description='')
Scalar values: Log a numerical or string value to the run with the given name. Logging a metric to a run causes that metric to be stored in the run record in the experiment. You can log the same metric multiple times within a run, the result being considered a vector of that metric.
Example: run.log("accuracy", 0.95)
Box 2: log_image
A box plot of income by home_owner.
log_image Log an image to the run record. Use log_image to log a .PNG image file or a matplotlib plot to the run. These images will be visible and comparable in the run record.
Example: run.log_image("ROC", plot=plt) Box 3: log_table
A dictionary containing the city names and the average income for each city. log_table: Log a dictionary object to the run with the given name.
Does this meet the goal?
Correct Answer:
A
- (Exam Topic 1)
You need to implement a feature engineering strategy for the crowd sentiment local models. What should you do?
Correct Answer:
D
The linear discriminant analysis method works only on continuous variables, not categorical or ordinal variables.
Linear discriminant analysis is similar to analysis of variance (ANOVA) in that it works by comparing the means of the variables.
Scenario:
Data scientists must build notebooks in a local environment using automatic feature engineering and model building in machine learning pipelines.
Experiments for local crowd sentiment models must combine local penalty detection data. All shared features for local models are continuous variables.
- (Exam Topic 3)
You are analyzing a dataset by using Azure Machine Learning Studio.
YOU need to generate a statistical summary that contains the p value and the unique value count for each feature column.
Which two modules can you users? Each correct answer presents a complete solution. NOTE: Each correct selection is worth one point.
Correct Answer:
BE
The Export Count Table module is provided for backward compatibility with experiments that use the Build Count Table (deprecated) and Count Featurizer (deprecated) modules.
E: Summarize Data statistics are useful when you want to understand the characteristics of the complete dataset. For example, you might need to know:
How many missing values are there in each column? How many unique values are there in a feature column?
What is the mean and standard deviation for each column?
The module calculates the important scores for each column, and returns a row of summary statistics for each variable (data column) provided as input.
References:
https://docs.microsoft.com/en-us/azure/machine-learning/studio-module-reference/export-count-table https://docs.microsoft.com/en-us/azure/machine-learning/studio-module-reference/summarize-data
- (Exam Topic 3)
You are planning to register a trained model in an Azure Machine Learning workspace.
You must store additional metadata about the model in a key-value format. You must be able to add new metadata and modify or delete metadata after creation.
You need to register the model. Which parameter should you use?
Correct Answer:
D
azureml.core.Model.properties:
Dictionary of key value properties for the Model. These properties cannot be changed after registration, however new key value pairs can be added.
Reference:
https://docs.microsoft.com/en-us/python/api/azureml-core/azureml.core.model.model
- (Exam Topic 3)
Note: This question is part of a series of questions that present the same scenario. Each question in the series contains a unique solution that might meet the stated goals. Some question sets might have more than one correct solution, while others might not have a correct solution.
After you answer a question in this section, you will NOT be able to return to it. As a result, these questions will not appear in the review screen.
You are analyzing a numerical dataset which contains missing values in several columns.
You must clean the missing values using an appropriate operation without affecting the dimensionality of the feature set.
You need to analyze a full dataset to include all values.
Solution: Replace each missing value using the Multiple Imputation by Chained Equations (MICE) method. Does the solution meet the goal?
Correct Answer:
A
Replace using MICE: For each missing value, this option assigns a new value, which is calculated by using a method described in the statistical literature as "Multivariate Imputation using Chained Equations" or "Multiple Imputation by Chained Equations". With a multiple imputation method, each variable with missing data is modeled conditionally using the other variables in the data before filling in the missing values.
Note: Multivariate imputation by chained equations (MICE), sometimes called “fully conditional specification” or “sequential regression multiple imputation” has emerged in the statistical literature as one principled method of addressing missing data. Creating multiple imputations, as opposed to single imputations, accounts for the statistical uncertainty in the imputations. In addition, the chained equations approach is very flexible and can handle variables of varying types (e.g., continuous or binary) as well as complexities such as bounds or survey skip patterns.
References: https://www.ncbi.nlm.nih.gov/pmc/articles/PMC3074241/
https://docs.microsoft.com/en-us/azure/machine-learning/studio-module-reference/clean-missing-data