- (Topic 2)
A 3rd party is marketing an application for financial institutions to use for credit scoring. This application is an example of what type of analytics?
Correct Answer:
B
Prescriptive analytics is the type of analytics that provides recommendations or suggestions for optimal actions or decisions based on data analysis. Prescriptive analytics uses techniques such as optimization, simulation, and decision analysis to generate and evaluate various scenarios and outcomes. Prescriptive analytics can help financial institutions to use credit scoring to determine the best loan offers, interest rates, and repayment terms for their customers, as well as to manage risk and compliance.
Prescriptive analytics is the most advanced and complex type of analytics, as it requires a high level of data quality, integration, and modeling, as well as human judgment and domain expertise. References:
✑ Certification in Business Data Analytics (IIBA ® - CBDA), IIBA, accessed on January 20, 2024.
✑ Business Data Analytics Certification - CBDA Competencies | IIBA®, IIBA, accessed on January 20, 2024.
✑ Guide to Business Data Analytics, IIBA, 2020, p. 15-16.
- (Topic 1)
An analyst at a phone manufacturing company is preparing a dashboard for Senior Executives that will cover past year's performance. It will be used in the upcoming senior leadership team meeting to make strategic decisions for the new year. While analyzing the data, the analyst found a lot of interesting revelations related to performance. What should the analyst keep in mind when preparing the Executive dashboard?
Correct Answer:
C
When preparing an executive dashboard, the analyst should keep in mind that the purpose of the dashboard is to provide a quick and clear overview of the past year??s performance and to support strategic decision making for the new year. Therefore, the analyst should keep the dashboard high-level, summarizing the key insights and metrics that are relevant and meaningful for the senior executives. The analyst should avoid cluttering the dashboard with too much detail or information that is not essential for the executives. The analyst should also use visual features, such as charts, graphs, and colors, to display the data in an organized and appealing way12 References: 1:Executive Dashboards: 10 Reporting Tips and Examples [2023] • Asana 2: How to Create Executive Dashboard & Reports - Ubiq BI
- (Topic 1)
The analytics team has been asked to provide an estimate of the number of customers they expect to have in 12 months. They debated how accurate that figure needs to be and determined that based on the availability of good data, they could predict within + or - 10%. This is an example of a:
Correct Answer:
A
A ROM estimate is a rough order of magnitude estimate that provides a quick and approximate estimate of the cost, time, or effort required for a project or a task. A ROM estimate is based on expert opinion or experience from past projects, and it usually has a large range of variation, such as + or - 10%. A ROM estimate is useful when there is limited information or data available, or when a high-level estimate is needed for planning or budgeting purposes. However, a ROM estimate also has a high degree of uncertainty and variability, and it should be refined as more details become available12 References: 1: Project Estimation Techniques Business Analysts Should Know About 2: Estimation techniques for business analysts – The Functional BA
- (Topic 2)
An analytics team completed their research to determine why customers are abandoning items in their online shopping cart. The team suggests improvements to the website to address the problem. The Director of Sales proclaims that the current website is fine and indicates that the problem materialized when the company increased its shipping rates. The solution proposed by the team seems misaligned. What has gone wrong?
Correct Answer:
C
Agreeing on the business problem is the first and most critical step in any analytics project, as it defines the scope, purpose, and objectives of the analysis, and aligns the expectations and interests of the stakeholders1. Agreeing on the business problem involves identifying the problem statement, the problem owner, the problem context, the problem impact, and the problem criteria2. If the team did not agree on the business problem, the solution proposed by the team may seem misaligned with the actual needs, preferences, or assumptions of the decision makers, and may not address the root cause or the main drivers of the problem. In this scenario, the team and the Director of Sales may have different views on what the business problem is, why it is important, and how it should be solved.
The other options are not correct explanations of what has gone wrong. This scenario can be addressed with analytics, as it involves using data to understand customer behavior, identify factors influencing cart abandonment, and recommend improvements to the website or the pricing strategy. The team may or may not have agreed on the root cause of the problem, but that is not the main issue, as the root cause analysis is a part of the data analysis step, not the problem definition step. The team may or may not have performed an insufficient amount of planning, but that is not the main issue, as the planning process is a subsequent step after the problem definition step, and it depends on the clarity and agreement of the business problem.
References:1: Guide to Business Data Analytics, IIBA, 2020, p. 252: Introduction to Business Data Analytics: A Practitioner View, IIBA, 2019, p. 11. : Guide to Business Data Analytics, IIBA, 2020, p. 25. : Introduction to Business Data Analytics: A Practitioner View, IIBA, 2019, p. 11.
- (Topic 2)
DIAGRAM TAKEN
An analyst at an organization has just learnt about bullet charts. For the latest dashboard, the analyst has decided to display the customer satisfaction rate from the latest 2018 customer survey results through a bullet chart while comparing it to the 2017 customer satisfaction rate.What can be gleaned from this chart?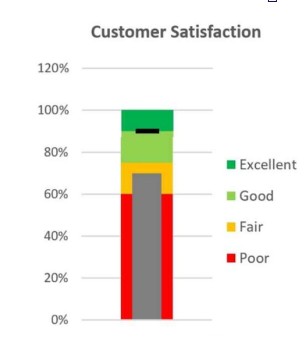
Customer Satisfaction
120%
100%
80%
Correct Answer:
D
A bullet chart is a type of bar chart that shows progress towards a goal or performance against a reference line1. It consists of a bar representing the featured measure, a reference line denoting a target or threshold, and a background with qualitative ranges (such as poor, fair, good, excellent)2. In this case, the featured measure is the customer satisfaction rate for 2018, the reference line is the target of 70%, and the background ranges are 0-50% (poor), 50-70% (fair), 70-90% (good), and 90-120% (excellent). The chart also shows a thin black bar representing the customer satisfaction rate for 2017, which can be used for comparison. From the chart, we can see that the 2018 customer satisfaction rate is at 90%, which falls in the excellent range and exceeds the target of 70%. We can also see that the 2017 customer satisfaction rate was at 70%, which falls in the good range and meets the target. Therefore, the correct answer is D, as it summarizes both the 2018 and 2017 customer satisfaction rates and their relation to the target and the ranges.
References:1: Understanding and Using Bullet Graphs | Tableau, 2: Bullet Charts - What Is It And How To Use It - JSCharting